SnackBox
Kids who start snacking can't stop — and no app notification will change that behavior. Digital-only interventions lack the physical presence to interrupt real-world habits.
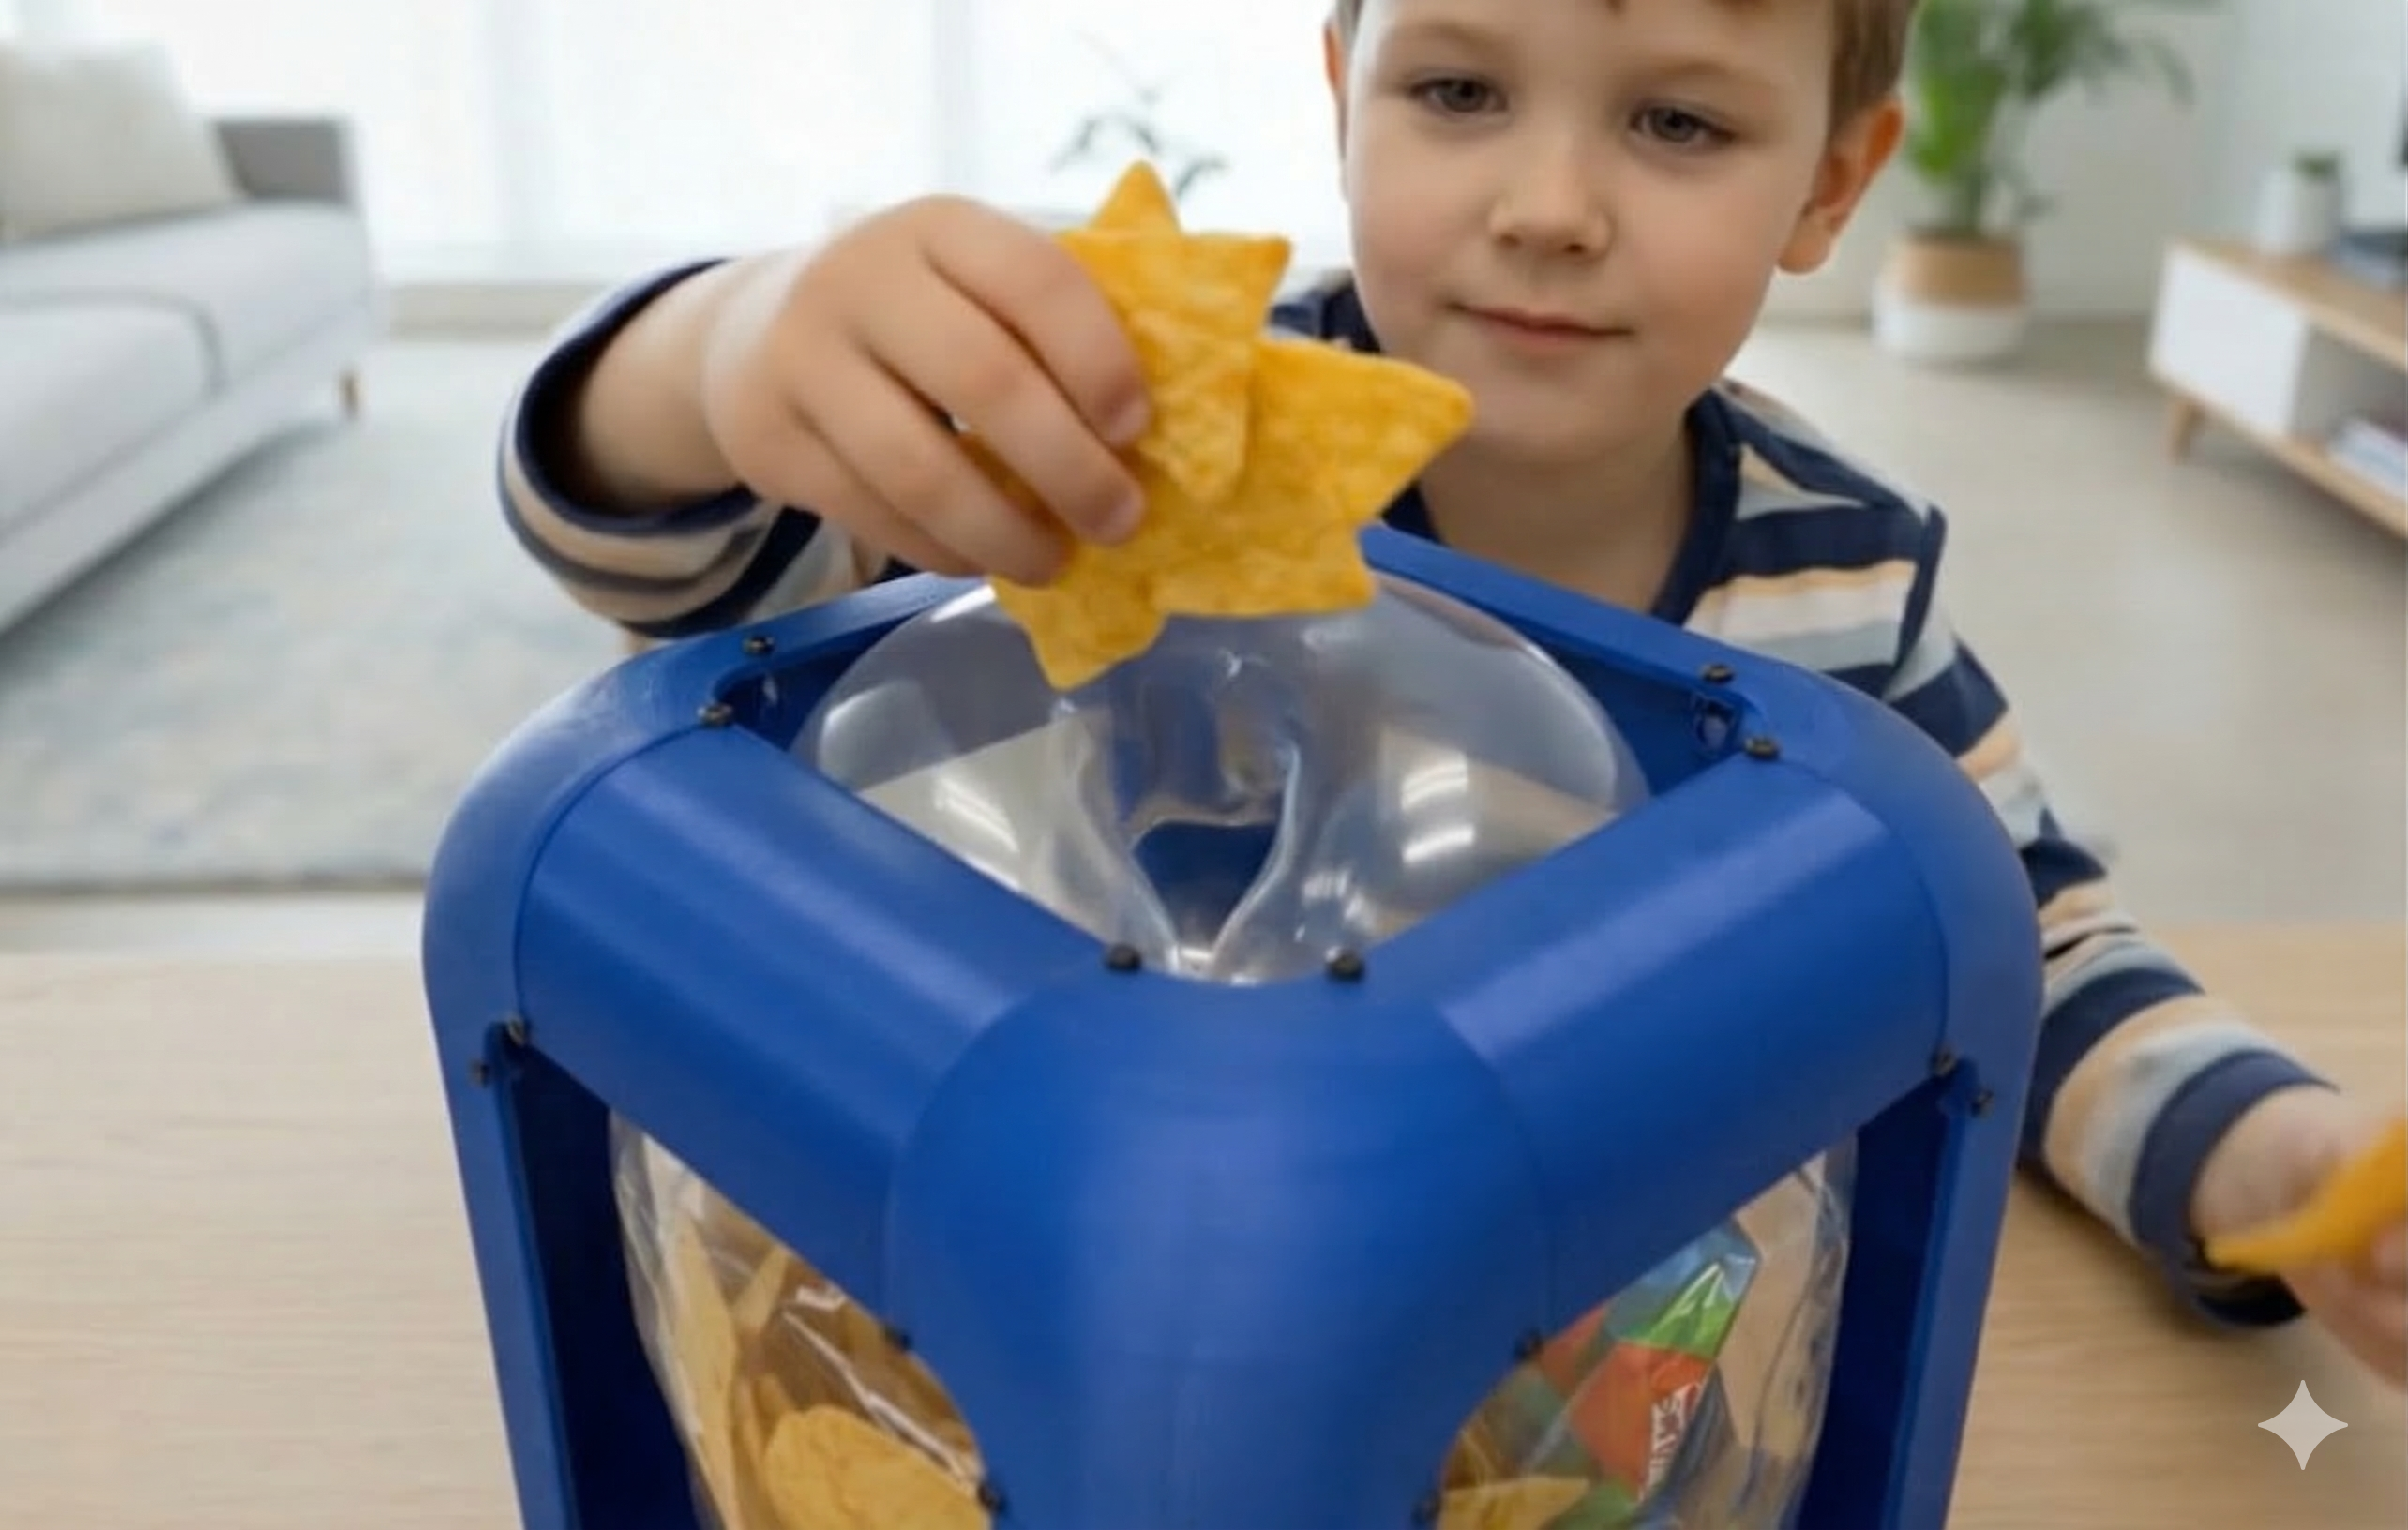
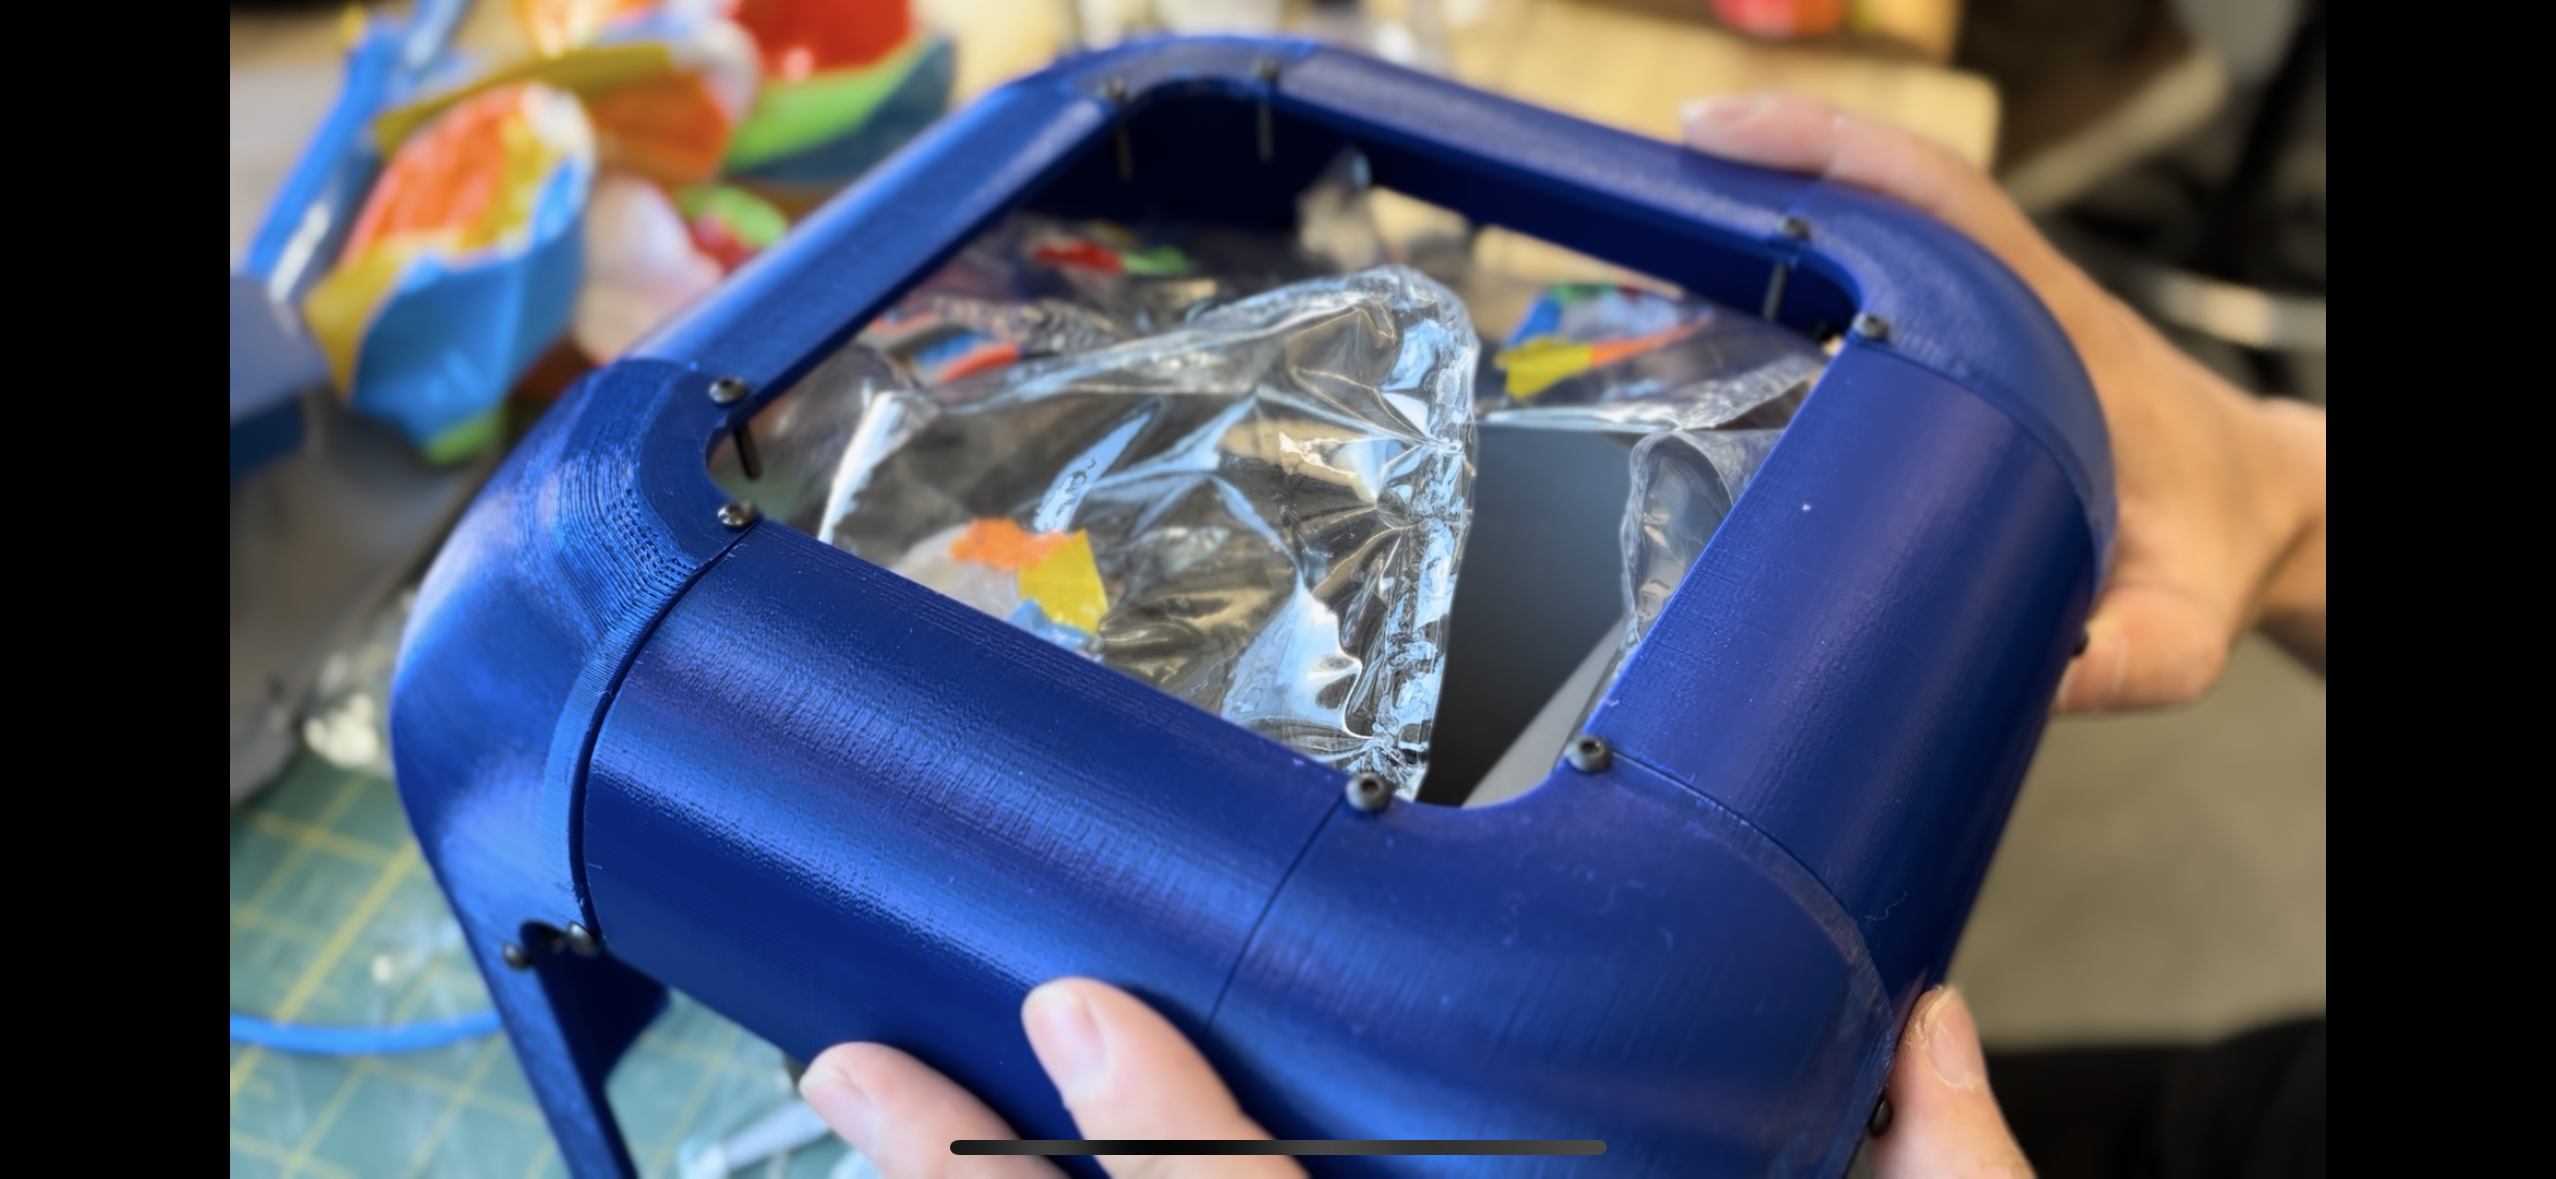
Designed an IoT calorie management device that physically controls access to snacks: a balloon inside the box inflates based on calorie intake, gradually closing the opening — and deflates when the user exercises.
Working prototype with gesture-based snack detection, barcode-scanned calorie tracking, AI-calculated intake limits, and a physical balloon mechanism that opens and closes based on real-time calorie balance.
Overview
SnackBox is a behavior design project disguised as an IoT device. Inspired by watching kids who can't stop snacking once they start, the system physically restricts access to snacks based on calorie data. A balloon inside the box inflates as you eat — gradually closing the opening. Exercise more, and the balloon deflates, reopening access. It's not an app telling you to stop; it's a box that won't let you reach in. The system connects a mobile app (barcode scanning + user profile), Google Sheets (cloud data layer), AI (calorie limit + balloon ratio calculation), and physical hardware (gesture sensor + air pump + balloon) into one closed-loop interaction.
Concept
SnackBox is not a consumer product — it's a concept prototype exploring how physical computing can shape health behavior. The core idea: instead of notifying users to eat less, physically limit access based on real calorie data. The system treats the snack box as both an input device (detecting hand gestures) and an output device (inflating a balloon to restrict access) — creating a tangible feedback loop between eating and exercising.
System Architecture
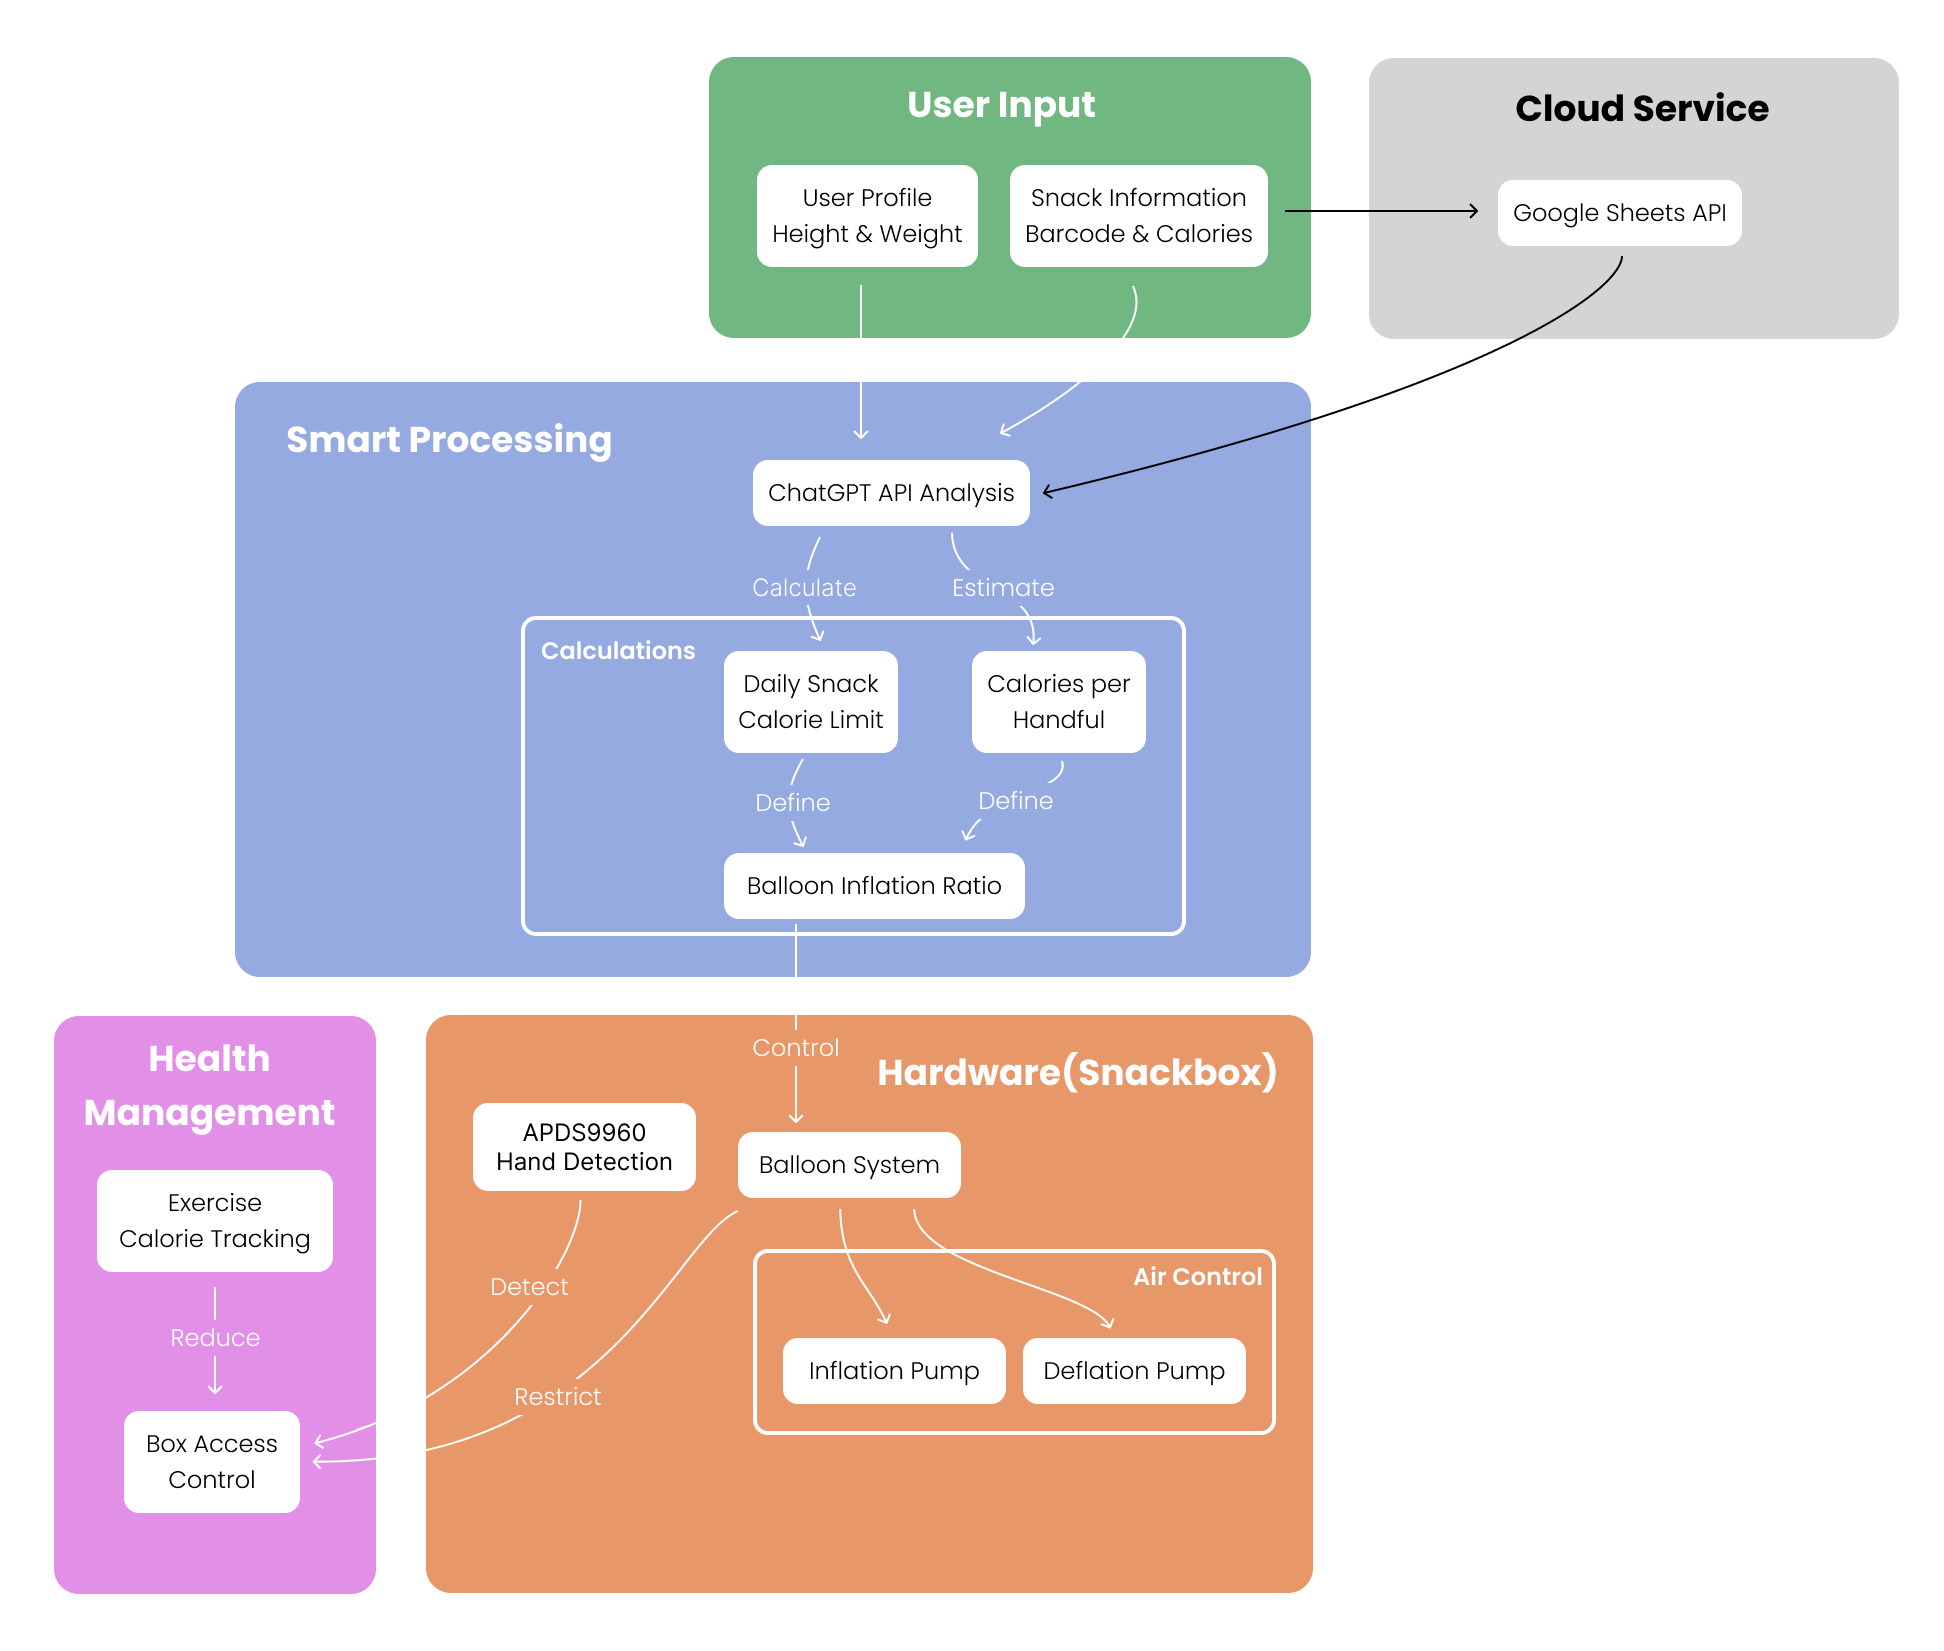
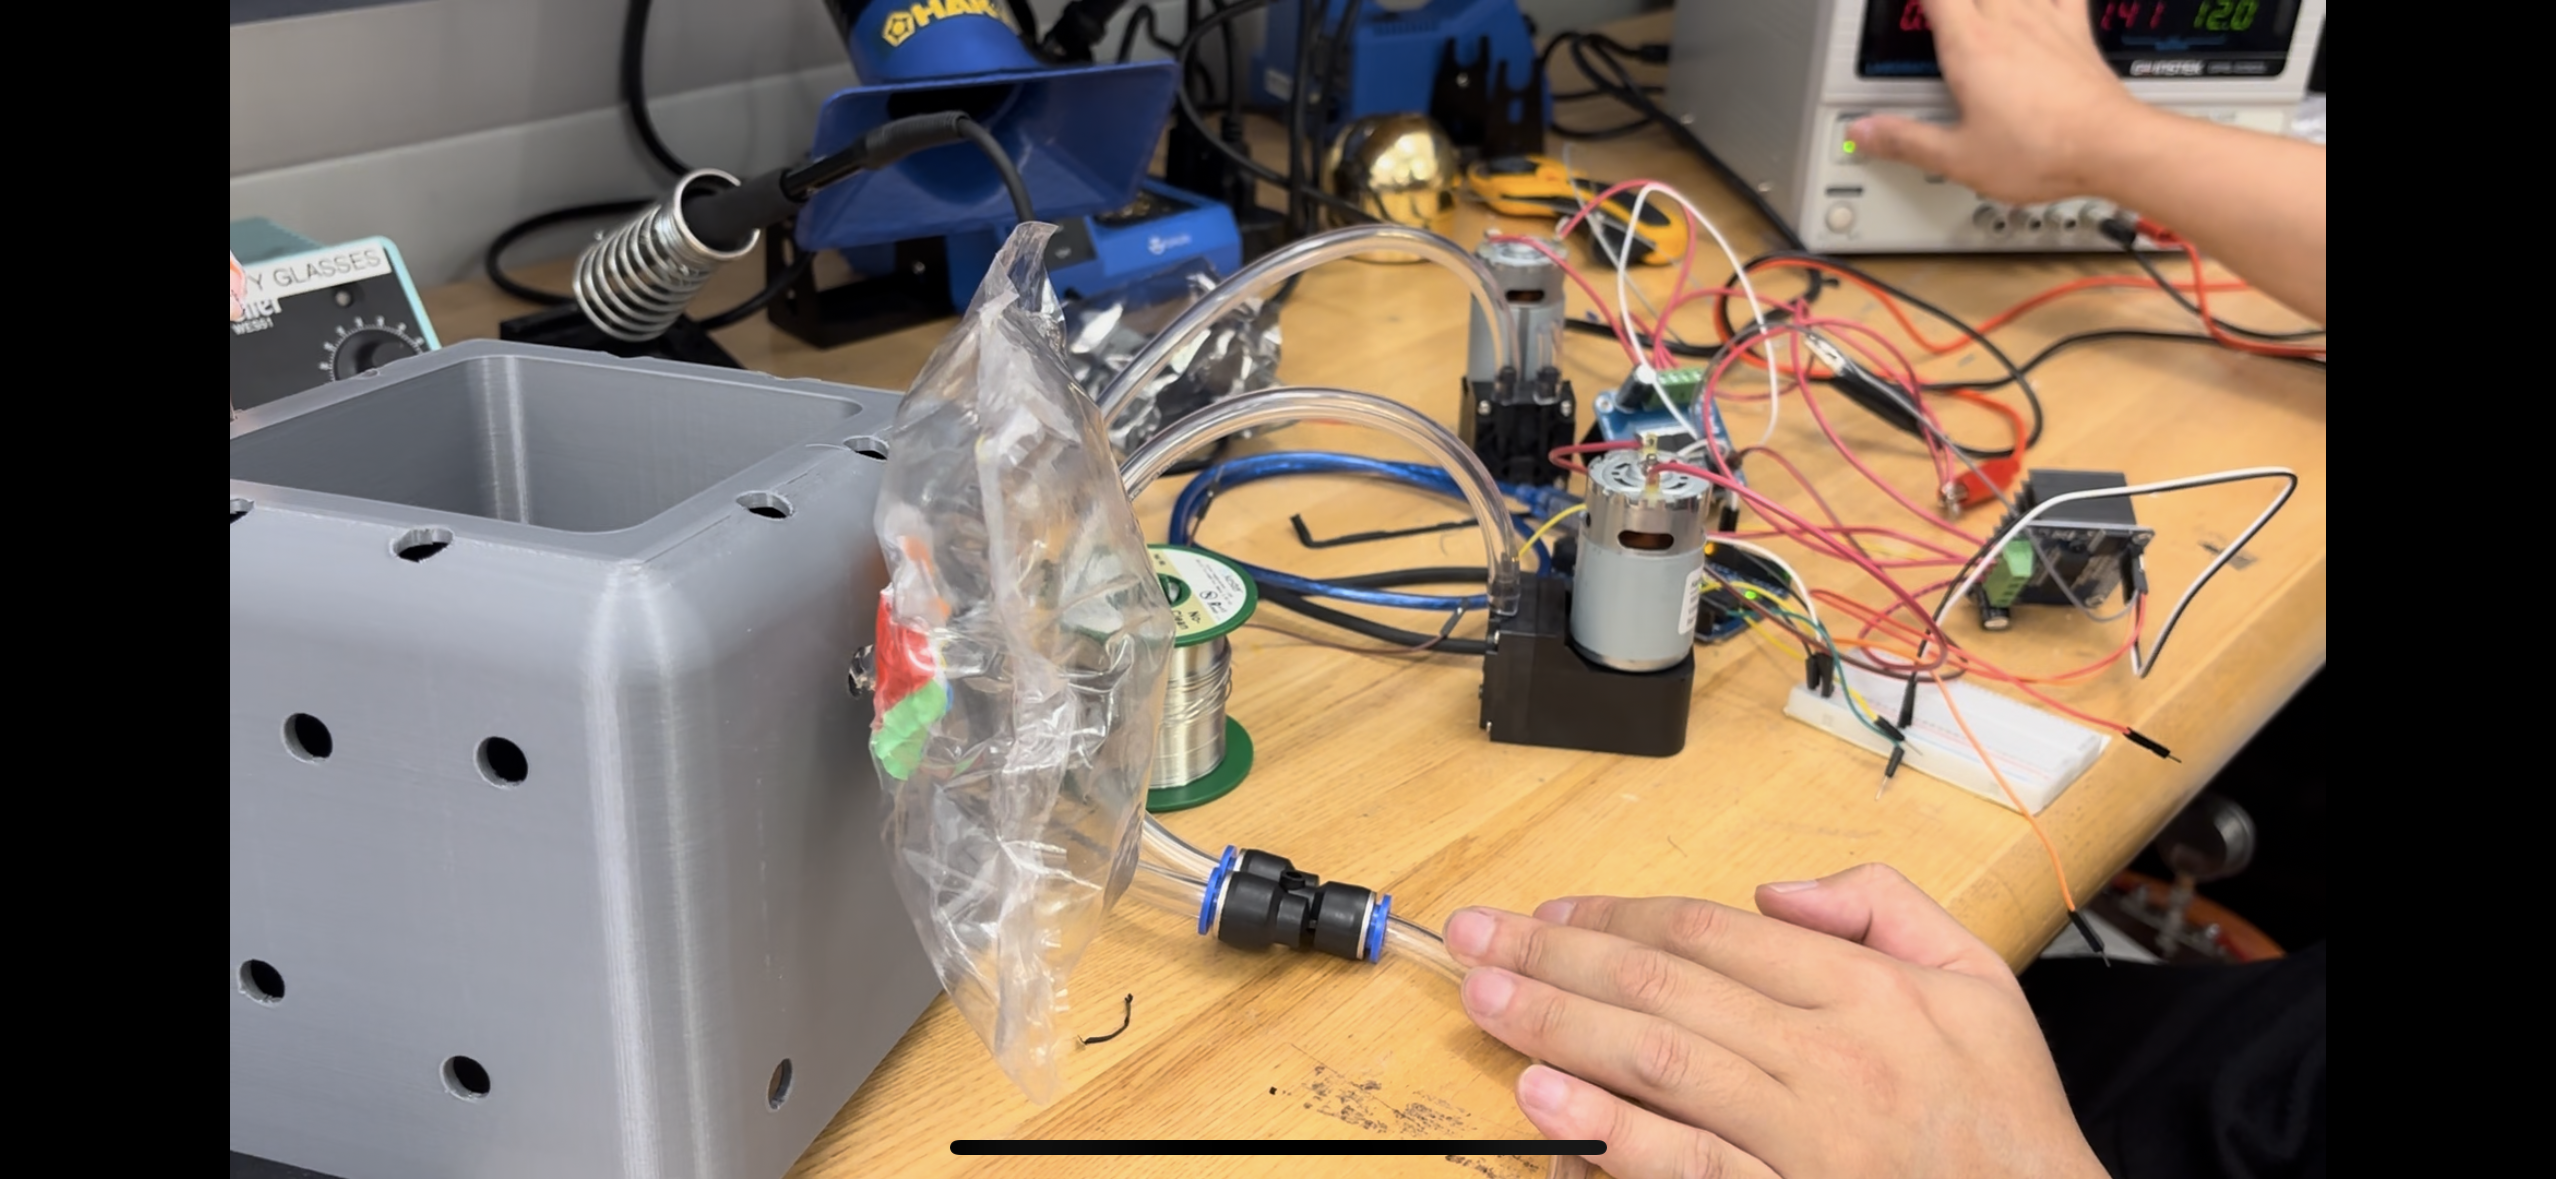
The system has four layers. (1) User Input: a mobile app where users enter height, weight, and scan snack barcodes to retrieve calorie data via API. (2) Cloud Data: Google Sheets serves as a lightweight database, storing user profiles, snack calories, and consumption history. (3) AI Calculation: processes cloud data to compute three values — daily snack calorie limit, estimated calories per handful, and balloon inflation ratio. (4) Physical Device: an APDS9960 gesture sensor detects hand insertion, a microcontroller reads cloud data and controls an air pump that inflates/deflates a balloon at the box opening — physically restricting snack access based on calorie balance.
Key Highlights
Physical Behavior Intervention
doesn't just track calories; physically restricts snack access through a tangible balloon mechanism
Closed-Loop System
eat more → box closes; exercise more → box opens — creating a direct feedback loop between behavior and consequence
HCI + Physical Computing
bridges interaction design with embedded systems, treating a snack box as both sensor and actuator
Gallery
Demo
Technical Details
Limitations & Next Steps
Weekly AI Report
Planned feature for weekly behavioral analysis and healthier snack recommendations was not fully implemented due to Google Sheets API and microcontroller integration challenges.
Prototype Stage
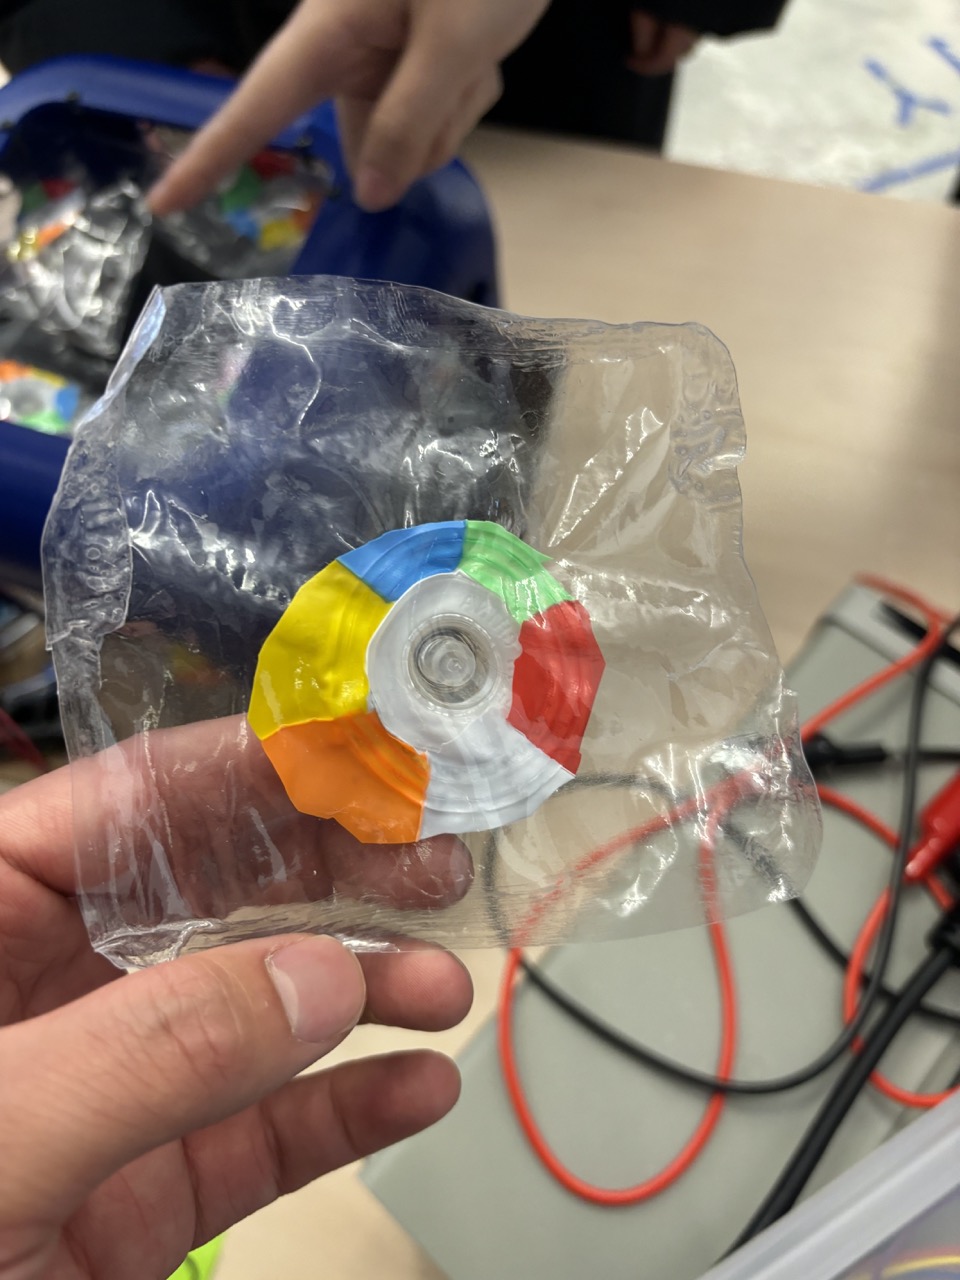
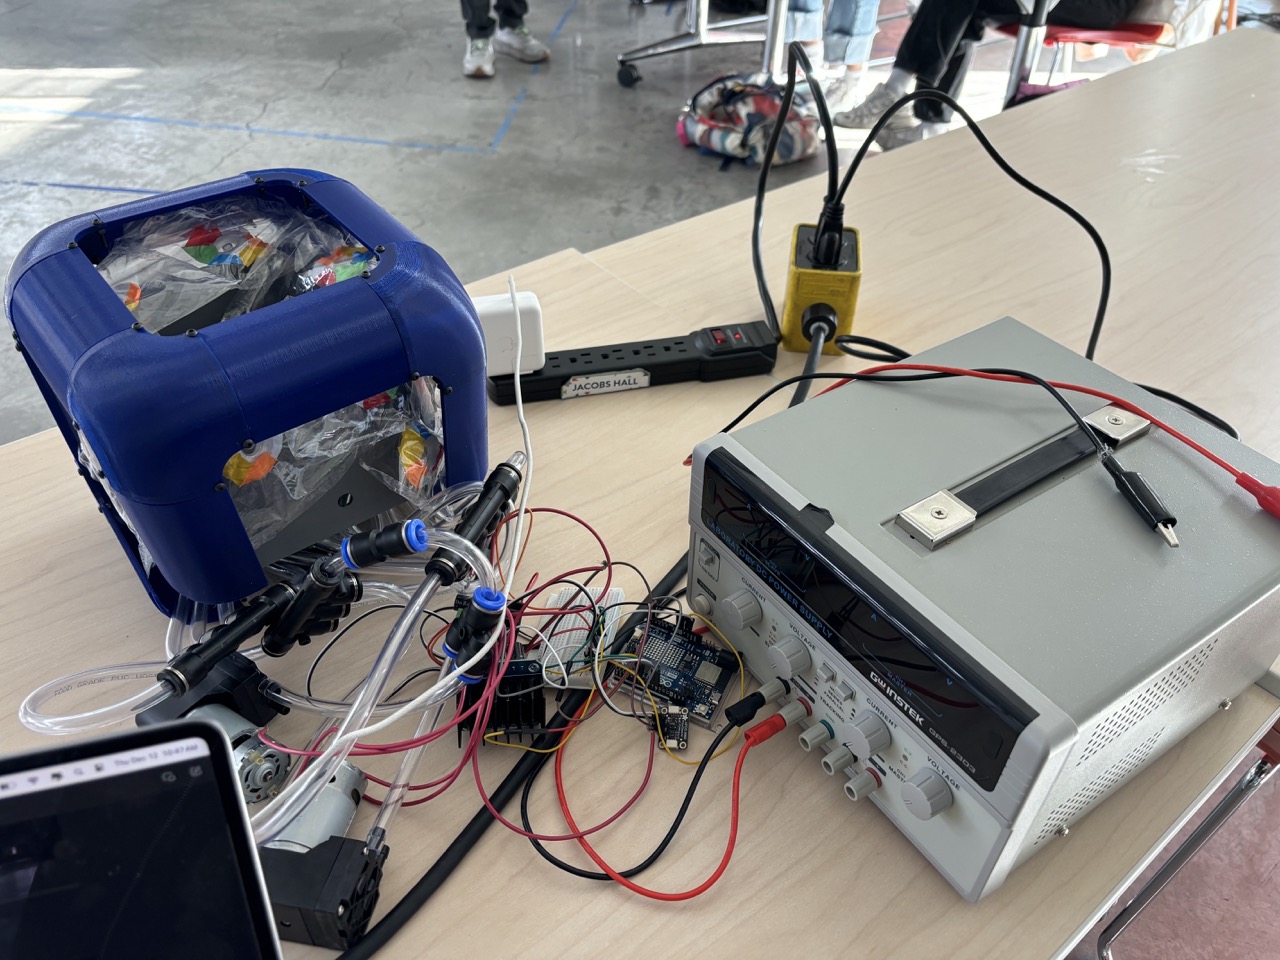
Hardware form factor is functional but not refined — the balloon mechanism and sensor placement need further industrial design iteration for real-world use.
Key Learnings
Physical interventions can be more effective than digital notifications for behavior change — tangible consequences create stronger feedback loops
Google Sheets as a lightweight cloud database enables rapid prototyping but hits limits with real-time microcontroller communication
Combining gesture sensing with actuator control in a single device requires careful timing and state management
Behavior design projects need to balance playfulness with functionality — the balloon concept is engaging precisely because it's physical and slightly absurd